- Created by Robert Reiner, last modified on 17. Jul 2020
projectdoc Toolbox
Renders a document graph in a graph language.
- Categories
- Extension
- Since
- 1.0
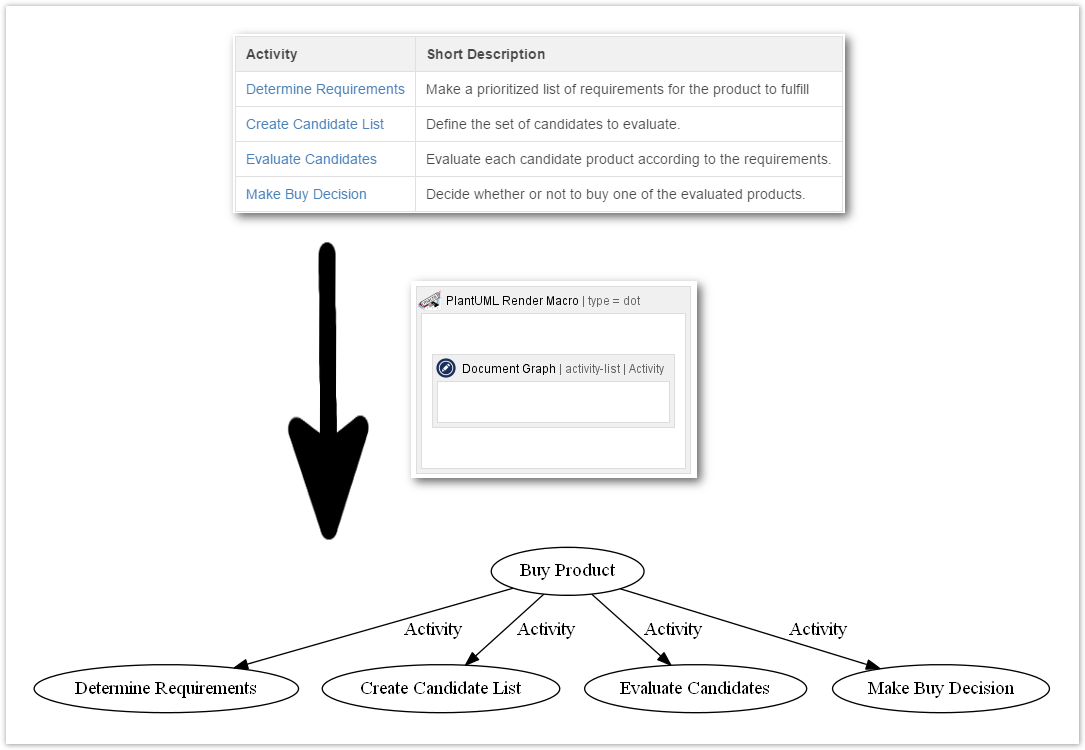
The graph macro traverses a limited number of projectdoc documents that are connected by attributes or association documents. On traversal it renders each encountered document as a node in a graph notation. Currently only DOT (Graphviz) is supported as an output format. Use the PlantUML for Confluence add-on to transfer the graph description into a graph.
Properties
Document
Specify the document to fetch the list of documents to traverse.
If the value is empty, the document the macro is on is selected.
Property
The name of the property of the document to fetch the list of documents to traverse.
The expected value is either a list of Confluence links or a list of links created by a projectdoc macro (it needs a data attribute named "data-projectdoc-id" on the rendered HTML anchor element). These links need to point to projectdoc documents.
The property may also specify a section containing references to documents.
Implicit Association
Check if this document links to first children.
That is make this document as the root node of the document tree.
Add Labels
Check if the edges should be labelled with the association names.
Selected Columns
If the Property parameter points to a section containing a table, specify the names of the columns to use for implicit associations.
Render Startdot
Adds @startdot at the first line.
Deactivated by default.
This is required by plantUML.
Render Digraph
Wraps the content inside a digraph element with the graph name.
This is required if the generated diagram is complete.
Activated by default.
Render Wrapper
Wraps graph description inside a preformat element.
This is required by plantUML.
Deactivated by default.
Render Text Newline
When checked a simple newline is rendered. Otherwise a XML break (br) is rendered.
Activated by default.
Graph Type
No longer supported!
Users need to define the four parameters for rendering the graph description individually.
Use
Specify the type of graph to render. This controls the syntax of the graph notation.
Valid values are
dot-plantuml- renders some additional information for the PlantUML Render Macro.dot-condensed- does not render the enclosing digraph element.
It defaults to dot-plantuml. The default can be set with the space property Graph Type.
Property Name for Node
Specify the name of the document property to label the graph nodes.
If not specified, the property name defaults to the Name Property (Name).
URL Property
Name of the document property that stores the URL. Defaults to the page URL.
If no URL should be rendered, then use #none as value.
Style Property / Entity
The name of the property with entity style information for style templates.
Defaults to projectdoc.extension.graph.style.entity.
Style Property / DOT
The name of the property with DOT style information.
Defaults to projectdoc.extension.graph.style.dot.
Type Property
The name of document property storing type information. The type information styles, specified by the property, are applied to the node projectdoc.extension.graph.style.dot automatically.
Defaults to "Type".
Graph Name
Specify the name of the graph.
Defaults to "projectdoc".
Maximum Level
Limit the depth of the nodes to this level.
The following example shows the rendering of a graph with its maximum node level set to 2.
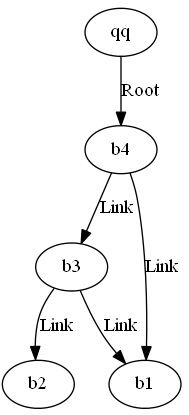
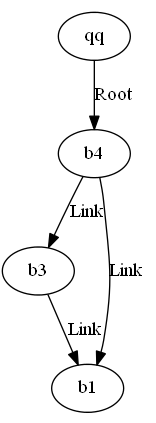
Note that the longest path is longer than the maximum level iff there is also a shorter path to the node that is within this limit.
Body
With the body of the macro the rendering of the graph is controlled.
This syntax is currently experimental and is subject to change.
Comment lines start with a hashmark ('#').
Names of nodes and edges select on document properties. If the document properties change, the specification in this macro does not.
Therefore by changing a selecting property of a document, the graph specification needs to be adjusted to reference the new name.
Properties to traverse
Specify the names of the properties to traverse. Each property is required to start on a new line. If you want to add graph attributes, add them separated by a colon.
My Property Name
My Property Name : color=green
The property names may refer to sections in which case all links are followed. If only links from a selected table column should be traversed, separate the name of that column with a slash from the property name.
My Property Name /  Select Column 1, Select Column 2
My Property Name /  Select Column 1, Select Column 2 : color=green
Each property specifies a subgraph element. To control the name of the graph (which defaults to the property name) use the '>' after the property name.
My Property Name > My_Subgraph_Name
My Property Name > My_Subgraph_Name /  Select Column 1 : color=green
Clusters
Nodes are grouped to clusters using the "CLUSTER: " prefix.
The following defines a cluster named "cluster_My Cluster Name" and adds the there nodes "Node1", "Node2", and "Node3" to it.
CLUSTER: My Cluster Name : Node1, Node2, Node3 : color=blue; style=filled
Note that the prefix "cluster_" will be prepended automatically in front of the chosen cluster name.
Separate by Semicolons!
It is important to separate the styles with semicolons. Otherwise the render engine will probably crash.
Graph Styles
Provide style information to be applied to graphs by the prefix "GRAPH: ". This style information is required on its own line.
The following adds styles to the main graph.
GRAPH: color=green
Each traversed property creates a new subgraph. Use the name of the property to apply styles specific to this subgraph.
GRAPH: My Subgraph Name : color=green; fontcolor="#000080"
Separate by Semicolons!
It is important to separate the styles with semicolons. Otherwise the render engine will probably crash.
Graph Items
Provide additional items (nodes and edges) to graphs by the prefix "PUT: ".
The following adds a line to the main graph.
PUT: A -> B
Each traversed property creates a new subgraph. Use the name of the property to add items specific to this subgraph.
PUT: My Subgraph Name : A -> B
Arrow Styles
Provide style information to be applied to arrows of the graph by lines starting with "ARROW: ".
ARROW: color=green
Node Styles
Provide style information to be applied to nodes of the graph by lines starting with "NODE: ".
NODE: My Node Name: color=green label="My Node"
Edge Styles
Provide style information to be applied to edges of the graph by lines starting with "EDGE: ".
EDGE: My Association Name: color=green label="My Association"
Styles may also be set to selected edges. The following example sets a style to the edge between the first and second node.
EDGE: Node Name 1 > Node Name 2 : style=blue
The more specific edge directive applies by overriding styles already set. For instance, if there is an EDGE directive that sets the color style with an association name and one that specifies the edge between two nodes, the latter will take precedence.
Pruning
Pruning allows to manually select nodes to prune the traversal.
The following will prune remove all edges that have the given node as a starting node.
PRUNE: My Node
The following only removes edges with the given label.
PRUNE: My Node: Association 1, Association 2
To prevent rendering a given node (not only pruning all edges), use the "PREVENT: " directive.
PREVENT: My Node
Apply Property Styles
Provide style information by properties to be applied to nodes. Specify the name of the property and the style template. The style template may contain placeholders (and typically does).
When a document is traversed, the specified property may point to a document. If it does, the property projectdoc.extension.graph.style.entity provides additional information applied to the template.
APPLY: My Property Name: style=${style}, color=${color}
For this example the document referenced by the property My Property Name provides a property with name projectdoc.extension.graph.style.entity whose value is set to color=blue, style=dashed (note that the order of the mappings is not relevant).
Per default the first encountered style is applied. There are other strategies to resolve duplicate styles. For instance for certain shapes and styles the color styles may be merged. To select the merge strategy for color styles, use merge-colors as selector.
APPLY: My Property Name / merge-colors : style=${style}, color=${color}
If the template should only be applied in case of the property matches a given value, use the assignment operator.
APPLY: My Property Name=Property Value / merge-colors : style=${style}, color=${color}
Multiple values may be connected by OR ('|') or AND ('&'). The operators may not be combined.
APPLY: My Property Name=Property Value 1|Property Value 2 / merge-colors : style=${style}, color=${color}
APPLY: My Property Name=PV1&PV2&PV3 : style=${style}, color=${color}
Styles may also be applied to Nodes. The following example applies styles to all nodes that have a property with a given value.
APPLY2NODE: > My Property Name=Property Value : style=${style}, color=${color}
Further examples match on nodes with and without constraints:
APPLY2NODE: My Node Name : style=${style}, color=${color}
APPLY2NODE: My Node Name > My Property Name=Property Value : style=${style}, color=${color}
Difference between APPLY and APPLY2NODE
In a nutshell the difference between APPLY and APPLY2NODE ist this:
- APPLY specifies an association, that is a property on a document, while APPLY2NODE specifies the name of a node that is the name of a document.
- Both allow to put one further constraint on the selection. While APPLY allows to specify a value for the specified property, APPLY2NODE allows to demand a value for a property on the specified document.
- Styles are applied to the node for the document that provides the association in case of APPLY. Styles are applied to the node of the referenced document in case of APPLY2NODE.
Details
No Recursion Detection
Please note that this macro does not detect recursions in case the macro itself is part of the property value or section body it references.
If you need to specify the graph as part of the section where the table of documents to traverse is also part of, then use the Content Marker Macro and put the table with a unique ID in it. Use this ID as the value to the Property Parameter.
Space Properties
The following space properties are consulted by this macro.
| Identifier | Short Description |
|---|---|
projectdoc.extension.graph.graph-type | Specifies the type used for rendering graphs. |
Usage Examples
Render Children
Suppose there is a document that describes the business process "Buy Product" by listing each activity associated with this process.
The activities may be selected by a query (for instances using the Display Table Macro) or by list of selected references (for instance using the Tour Macro). Either way, the list of activities associated with the process is rendered something like this:
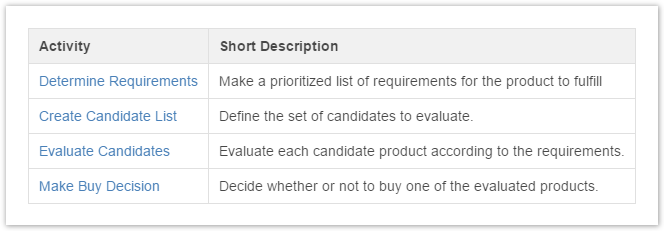
To render the association of the process (the document that lists these activities) to its activities, use this macro like this:
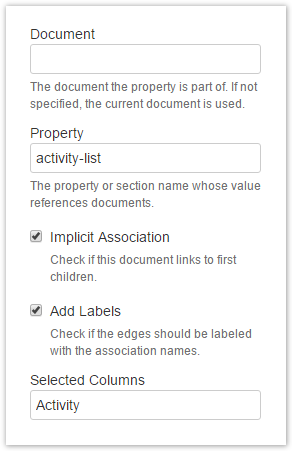
This will render the graph in DOT syntax:
@startdot
digraph projectdoc {
  subgraph Activity {
    "Buy Product" -> "Determine Requirements" [label="Activity"]
    "Buy Product" -> "Create Candidate List" [label="Activity"]
    "Buy Product" -> "Evaluate Candidates" [label="Activity"]
    "Buy Product" -> "Make Buy Decision" [label="Activity"]
  }
}
@enddot
Using the PlantUML Render Macro will render the graph as an image.

Traverse Properties
The macro traverses the document tree by the properties specified in the body of the macro. Each property value is supposed to contain a list of references to projectdoc documents.
Let's extend the previous example so that each activity is associated with one or more role documents. The property that stores this information is named "Role". Then make the Role property be a significant link for the graph:
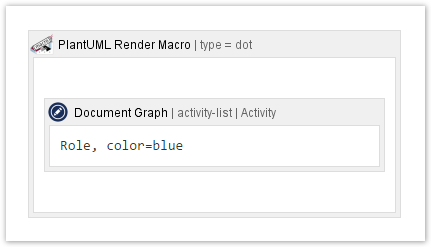
For each traversed document (beyond the implicit root that is the process document), the Role property will add additional nodes to the graph. Since we add a style information (blue edges), the graph is rendered like this:

Related macros
- Transclusion to Text Macro
- Transcludes content from a document marked with the content marker macro and renders it as plain text.
- Body Graph Macro
- Renders a document graph in a graph language allowing the body to contain arbitrary content (including transclusions).


